

If you were a cytogeneticist in the early 1960s, studying human chromosomes was a frustrating business. Stains like aceto-orcein or Feulgen would colour all chromosomes more or less evenly, making them appear as smooth, pale rods. With skill, you could tell the largest chromosomes from the smallest, but the smaller ones were practically indistinguishable. It was like looking at a shelf of identical books with no titles and trying to guess which story each one held.
The first real breakthrough came in 1956, when Tjio and Levan correctly determined the human chromosome number to be 46. But even with the correct count, identifying individual chromosomes remained mostly guesswork. Researchers could detect only very large abnormalities like extra whole chromosomes or missing ones. Subtle rearrangements and microdeletions remained invisible.
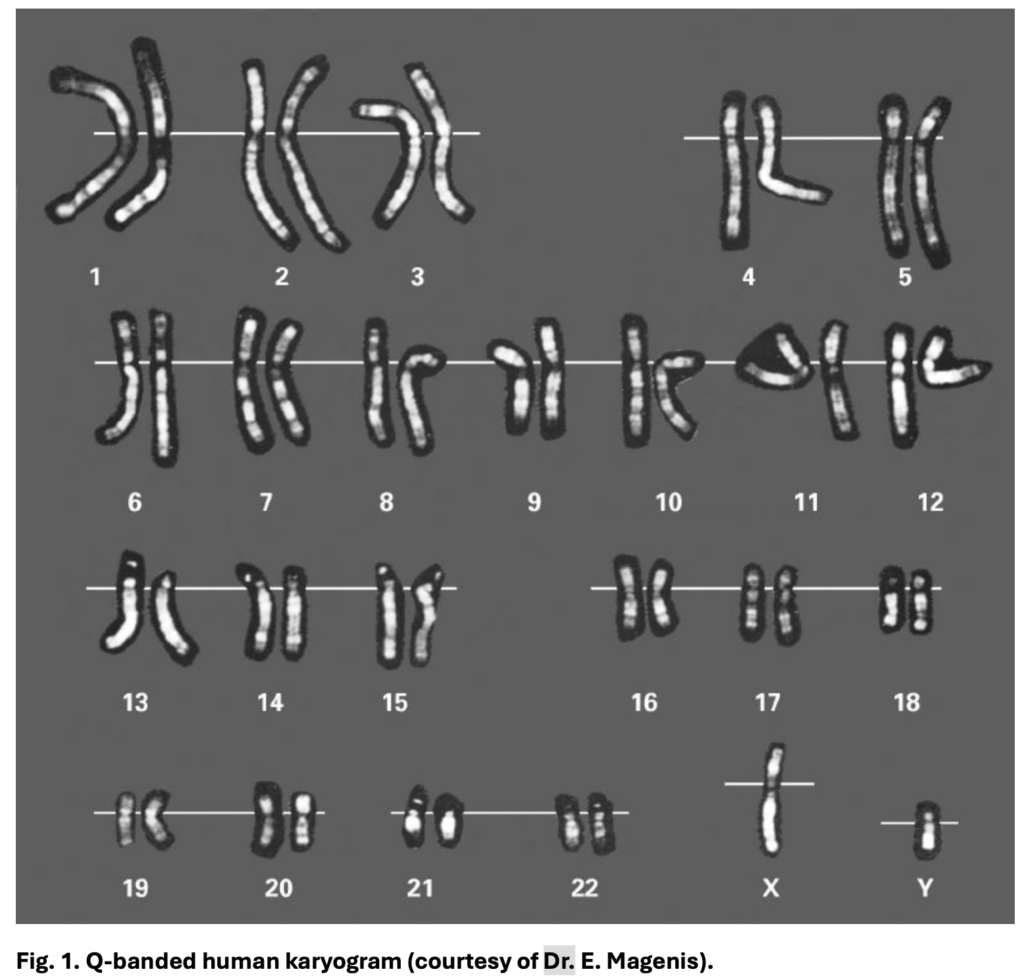
The revolution arrived in the early 1970s. In 1971, a group led by Torbjörn Caspersson in Sweden developed the first fluorescent banding technique, using quinacrine mustard. Under ultraviolet light, each chromosome glowed in a distinctive pattern of bright and dim regions. This method, called Q-banding, proved for the first time that every chromosome had a unique “fingerprint”. A pattern that could be recognised from cell to cell and person to person.
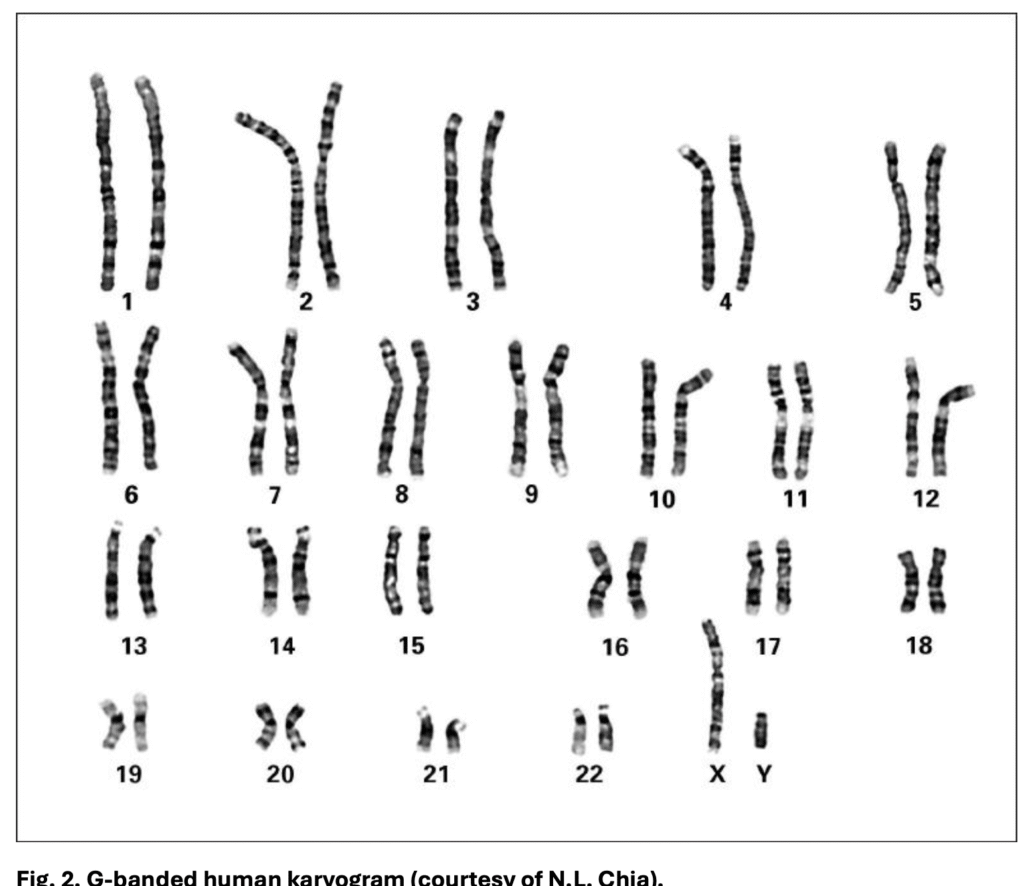
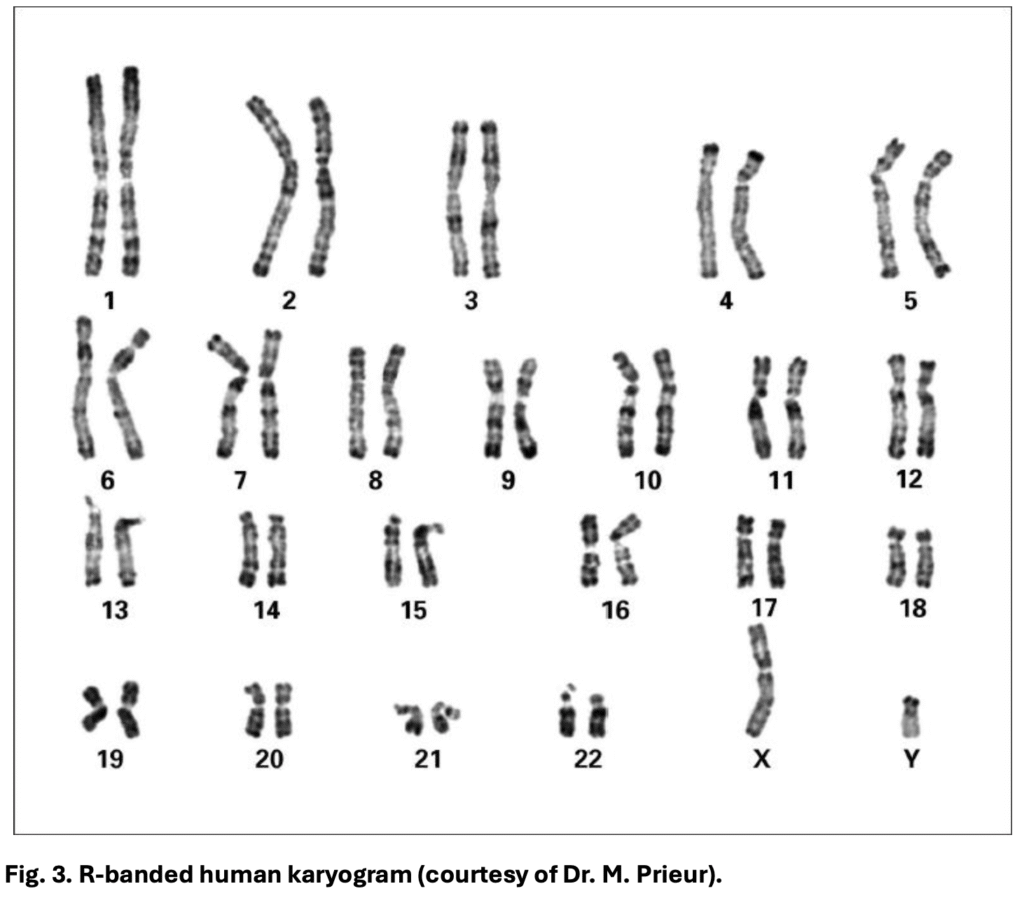
Soon after, in 1971, Patricia Jacobs and Lore Zech introduced G-banding, which used a simple visible-light dye (Giemsa) after mild enzymatic digestion of chromosomes. This produced patterns virtually identical to Q-banding but without the need for fluorescence microscopes. G-banding was not only easier but more stable; the patterns didn’t fade over time. The same year, French researchers developed R-banding (Reverse banding), revealing the opposite pattern, dark gene-rich areas and light AT-rich areas.
The excitement in the field was so great that, in September 1971, cytogeneticists from around the world met at the Paris Conference to agree on a unified system for describing these new banding patterns. They decided that Q-, G-, and R-banding patterns corresponded closely enough to create a single “idiogram”; a reference diagram of each chromosome’s bands, and to use the same numbering system regardless of which banding method was employed. This Paris Conference became the birth of standardised cytogenetic nomenclature, which evolved into today’s International System for Human Cytogenomic Nomenclature (ISCN). The conference of 1971, with its 1975 supplement, introduced a standardized three-letter code for describing chromosome banding methods. In this system, the first letter indicates the type of banding (such as G, Q, R, C, or T), the second letter refers to the technique used (for example, H for heating, F for fluorescence, T for trypsin, or B for barium hydroxide), and the third letter specifies the stain applied (such as G for Giemsa, Q for quinacrine, or A for acridine orange). However, not every banding abbreviation fits neatly into this three-part format.
Over the decades, ISCN has refined the rules, defining how bands are numbered, how landmarks like centromeres and telomeres are marked, and how variable regions are handled. What began as a handful of pioneering techniques in the early ’70s is now a suite of methods that can produce anything from a panoramic view of all chromosomes to an ultra-zoom on a single specialised region.
Two Broad Families of Banding Techniques
From a classification standpoint, all banding techniques fall into one of two broad categories.
The first group consists of whole-chromosome banding techniques. These stain chromosomes along their entire length, producing a repeating light–dark pattern that acts like a barcode. This allows quick identification of each chromosome, spotting translocations, inversions, deletions, or duplications anywhere along their length. Techniques in this group include G-banding, Q-banding, R-banding, and high-resolution banding.
The second group comprises region-specific banding techniques. Instead of painting the whole chromosome, these target particular structures: the centromere, telomeres, or special DNA-rich functional zones. They are like zooming in on a single landmark in a city — the main bridge, the city hall, or the harbour lighthouse. Examples include C-banding, T-banding, NOR staining, and DA-DAPI staining.
Whole-Chromosome Banding
The analogy of a city map works well here. A city map shows you all the districts, main roads, and landmarks at once. In the same way, whole-chromosome banding shows you the chromosome in its entirety, allowing you to orient yourself and spot major structural changes.
The global workhorse is G-banding. In this method, chromosomes are partially digested with trypsin and stained with Giemsa. The result is alternating dark and light stripes. The dark bands tend to be AT-rich, have fewer genes, and replicate late in the cell cycle; the light bands are GC-rich, gene-rich, and replicate early. G-banding became the standard because it is simple, reproducible, and works with an ordinary light microscope. It is the method used in routine karyotyping worldwide, whether for diagnosing Down syndrome, identifying structural rearrangements in leukaemia, or confirming balanced translocations in infertility cases.
Q-banding, the pioneer technique, uses quinacrine or related fluorescent dyes. Under UV light, bright fluorescent areas match the dark G-bands, and dim areas match the light G-bands. Its ability to highlight certain Y chromosome regions and polymorphic blocks still gives it niche uses, though it has largely been replaced by G-banding for routine work due to fluorescence fading.
R-banding produces the reverse pattern of G-banding. GC-rich, gene-rich regions stain dark, and AT-rich, gene-poor regions stain light. This is achieved through heat treatment or BrdU incorporation before staining. Its main advantage is in revealing telomeres and subtelomeric regions, making it particularly useful in detecting subtle terminal deletions. R-banding is still very popular in France.
High-resolution banding is essentially G- or R-banding performed earlier in cell division, during prophase or prometaphase. At this stage, chromosomes are longer and less condensed, revealing many more bands, sometimes over a thousand, compared to a few hundred at metaphase. This allows detection of smaller structural changes, such as microdeletions or microduplications, that standard metaphase analysis might miss.
Region-Specific Banding
Region-specific banding is the equivalent of switching from a whole-city map to a close-up of a single bridge or building. Here, you do not see the full barcode; instead, you focus on a specific part.
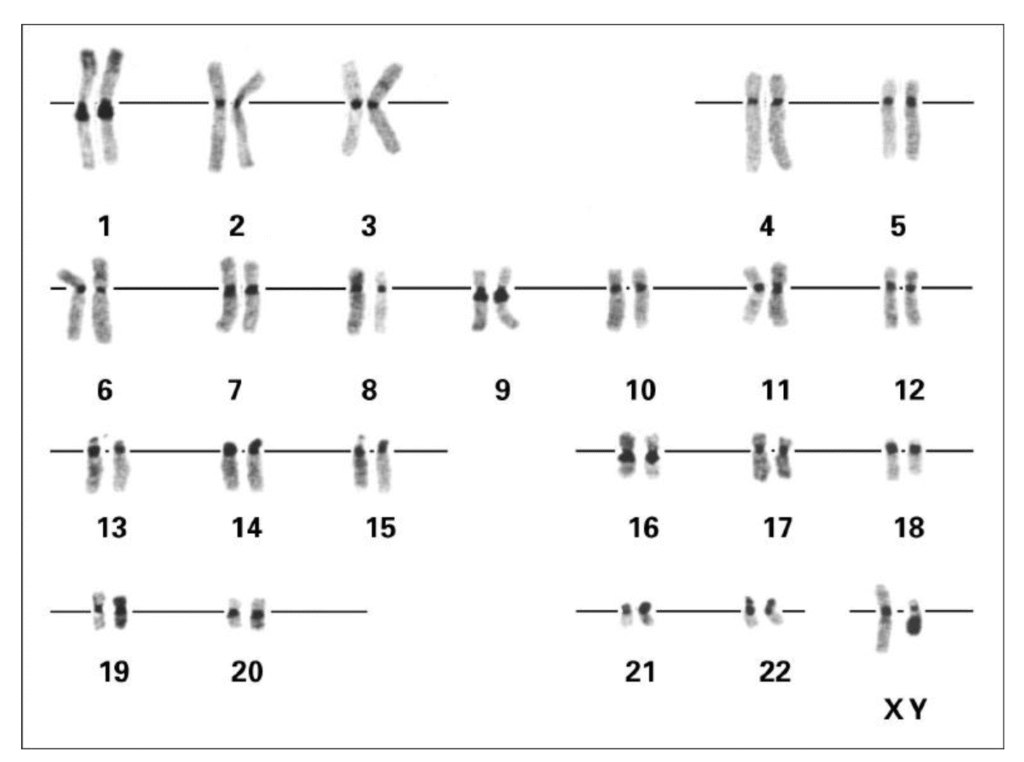
C-banding targets constitutive heterochromatin, mostly around the centromere. Using barium hydroxide and Giemsa staining, these regions appear as dark blocks. They help identify centromeric size variants, common on chromosomes 1, 9, 16, and Y, and are useful for identifying marker chromosomes in abnormal karyotypes. In C-banding, chromosome spreads fixed in methanol–acetic acid are treated with hot saturated barium hydroxide, which partially denatures DNA. Euchromatin is denatured extensively and loses its DNA–protein structure, while heterochromatin which is densely packed, rich in repetitive AT-rich sequences, and protected by proteins like histone H1 and HP1 resists this damage. Incubation in saline-sodium citrate (SSC) allows heterochromatin to renature rapidly, leaving euchromatin largely single-stranded. On staining with Giemsa, the renatured DNA–protein complexes in heterochromatin bind dye strongly, producing the characteristic dark centromeric bands.
T-banding is a variation of R-banding that emphasises telomeres, the protective ends of chromosomes made of TTAGGG repeats. Telomere integrity is vital for chromosome stability, and their visualisation is important in research on aging, cancer, and telomere biology disorders.
NOR staining uses silver nitrate to highlight nucleolar organiser regions, the sites of ribosomal RNA gene clusters on the short arms of the five acrocentric chromosomes. These regions appear as black dots if they are active, allowing functional as well as structural assessment.
DA-DAPI staining combines a DNA-binding chemical, Distamycin A, with the fluorescent dye DAPI, both of which bind preferentially to AT-rich regions. This is especially useful for visualising heterochromatic blocks like 1q12, 9q12, 16q11.2, and Yq12, often revealing benign polymorphisms important for correct chromosome identification.
Why Banding Still Matters in the Molecular Age
Modern cytogenetics now includes FISH, chromosomal microarray, and optical genome mapping. These can detect smaller changes. But banding still offers something unique, the ability to see the genome as a whole, with all its structural relationships intact. Balanced rearrangements, complex chromosomal reshuffling, and visual confirmation of abnormalities all remain the domain of banding.
It is also a cost-effective screening tool. An experienced cytogeneticist can, within hours, interpret a well-prepared banded karyotype and decide whether molecular follow-up is necessary.
Disclaimer
Genecommons uses AI tools to assist content preparation. Genecommons does not own the copyright for any images used on this website unless explicitly stated. All images are used for educational and informational purposes under fair use. If you are a copyright holder and want material removed, contact doc.sarathrs@hotmail.com.
Join Our Google Group
Click on the button and join our Google group to receive our weekly newsletter.